CHICAGO — After COVID-19 ravaged 2020’s self-service laundry profits, the industry rebounded in 2021. Based on results from this year’s American Coin-Op annual State of the Industry survey, many self-service laundry owners and operators are still working their way back.
But despite any challenges left by the pandemic and more recently by inflation and higher costs, nearly three out of four owners polled this year say their total business improved in 2022.
The annual State of the Industry Survey report provides many statistics valuable to store owners and investors who wish to compare their operations to the industry average. This year’s survey focused on 2022-23 business conditions, vend pricing, equipment, turns per day and utilities cost.
When asked about their 2022 business results, respondents were given the opportunity to state whether their results were up, down or unchanged. (Surveys conducted prior to 2012 asked only if business was up or down, so keep this in mind if you’re making comparisons to results of that vintage.)
The annual survey is an unscientific, online poll of American Coin-Op readers who operate stores. Some percentages may not equal 100% due to rounding or other factors.
GETTING ACQUAINTED
More than half of respondents polled this year—52.3%—own just one self-service laundry, while the remainder are multi-store owners (26.2% own two or three stores, 21.5% own four or more).
In terms of store size, 43.1% say their largest covers 3,000 square feet or more, 33.8% say it’s between 2,000 and 2,999 square feet, and the remaining 23.1% say it measures 1,999 square feet or less.
Approximately 47% of respondents own their store space, 42.2% rent their store space, and the remaining 10.9% say their arrangement varies by property.
Fully attended stores among the audience polled account for 46.2%. Roughly 31% are partially attended, and 16.9% are unattended. Among the remaining 6.2%, the arrangement varies by store.
More than 86% of laundry owners surveyed employ either part-time or full-time workers in their stores. Of these, 58.9% have four or more employees, 28.6% employ two or three, and 12.5% have only one employee.
On average, responding store owners have 4.6 full-time employees and 7.2 part-time employees (this calculation reflects averages by respondent, not by store).
Among these store owners, when compensating their non-management-level attendants, 12.1% pay an average hourly wage between $10 and $10.49, 1.7% pay $11-$11.49, 3.4% pay $11.50-$11.99, 37.9% pay $12-$14.99, and 39.7% pay $15 or more. The remaining 5.2% say all of their employees are management level.
As for payment types accepted, 75.4% of respondents say they offer coin, 49.2% offer card, and 26.2% offer other non-coin systems (store owners were asked to identify every type that applies to their operations). Roughly 46% of respondents offer customers more than one type of payment, compared to 53% last year.
American Coin-Op asked respondents to name which ancillary services their stores offer from a list of 20 choices, with an option to identify others. When checking all that applied to them, soap vending was a choice of 90.6%, followed by soft drinks and/or snack vending (82.8%), laundry bag sales (70.3%), drop-off wash/dry/fold service (68.8%) and Wi-Fi access (68.8%).
Respondents were also asked how they had advertised their store(s) in the past 12 months. They were provided a list of 14 choices plus given the option to identify others. Named most often was the store’s website (49.2%), followed closely by social media (46.2%). Other popular choices included signs or banners (35.4%), in-store promotions (32.3%) and digital ads (29.2%).
What are the biggest challenges you face in operating your laundry business today? In asking that in this year’s survey, American Coin-Op offered a list of nine, plus the option to write in “other” choices, and directed operators to select all that apply.
Here are the results:
- High cost: utilities (75.4%)
- High cost: new equipment (43.1%)
- High cost: labor (37.0%)
- Finding/keeping reliable employees (33.8%)
- High cost: maintenance (20.0%)
- Equipment abuse/vandalism (18.5%)
- High cost: rent (16.9%)
- “Other” (9.2%)
- Poor industry image, and too much competition (tie, 6.2%)
2022 BUSINESS VS. 2021
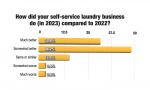
For 2022, nearly three-quarters of respondents (71.4%) say their overall self-service vended laundry business in gross dollar volume increased from that of 2021. By comparison, 86.7% reported increases in the 2021-22 survey.
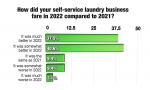
The average 2022 business increase was 13.2%, down from 17% in 2021. Other past average business increases have been 7.1% (2020), 12.6% (2019), 9.9% (2018), 9.4% (2017) and 11.2% (2016).
Following is a breakdown of 2022 business increases (the figures relate to those reporting increases, not all respondents):
- Operators with a business increase of less than 10%: 25.7%;
- Operators with a business increase of 10-14%: 34.3%;
- Operators with a business increase of 15% or more: 40.0%.
Roughly 8% of operators polled faced a decrease in total business (in gross dollar volume) in 2022, compared to less than 4% in 2021. Results from previous years showed the following business declines: 58% in 2020, 12% in 2019, 8% in 2018, 10% in 2017, and 22% in 2016.
The average 2022 business decrease was 8.9%, compared to 20.0% reported for 2021. Other prior average decreases were 20.5% (2020), 7.5% (2019), 5.0% (2018), 6.7% (2017) and 9.1% (2016).
Among respondents who reported experiencing decreased business in 2022, the drop was as low as 4% or as high as 20%.
Roughly 18% of respondents say their 2022 business was unchanged compared to 2021 business.
Check back Thursday for Part 2: Drop-off wash/dry/fold, commercial laundry business, and vending sales performance
Have a question or comment? E-mail our editor Bruce Beggs at [email protected].