CHICAGO — After COVID-19 ravaged 2020’s self-service laundry profits, the industry rebounded in 2021. Based on results from this year’s American Coin-Op annual State of the Industry survey, many self-service laundry owners and operators are still working their way back.
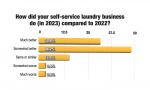
But despite any challenges left by the pandemic and more recently by inflation and higher costs, roughly three of every four owners polled this year say their total business improved in 2022.
The annual State of the Industry Survey report provides many statistics valuable to store owners and investors who wish to compare their operations to the industry average. This year’s survey focused on 2022-23 business conditions, vend pricing, equipment, turns per day and utilities cost.
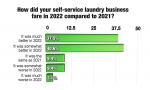
When asked about their 2022 business results, respondents were given the opportunity to state whether their results were up, down or unchanged. (Surveys conducted prior to 2012 asked only if business was up or down, so keep this in mind if you’re making comparisons to results of that vintage.)
The annual survey is an unscientific, online poll of American Coin-Op readers who operate stores. Some percentages may not equal 100% due to rounding or other factors.
Part 1 examined the characteristics of the self-service laundry audience. Part 2 analyzed year-over-year self-service business, drop-off wash/dry/fold, commercial laundry, and vending sales performance. Part 3 covered wash and dry vend pricing trends. Let’s conclude:
PURCHASED IN 2022
Nearly 51% of respondents purchased at least one piece of equipment (washer, dryer, water heater, vending machine, or other) in 2022, which is just a couple percentage points below our last annual survey.
Following is a breakdown of 2022 purchases by respondent (percentages do not total 100% because some buyers purchased equipment in multiple equipment categories):
- 12.1% purchased at least one top loader, with the average buy being 8.9 machines.
- 78.8% purchased at least one front loader, with the average buy being 17.1 machines.
- 48.5% purchased at least one dryer (regular or stack), with the average buy being 25.1 machines. (Editor’s note: This accounting includes a small number of operators who each purchased 40 or more machines last year.)
- 33.3% purchased a water heater.
- 33.3% purchased a vending machine.
Respondents to this year’s survey also listed changers, floor scrubbers, credit card systems, soap/bag venders and air conditioning units among the equipment they had purchased.
2023 SHOPPING LIST
Operators were also asked if they have purchased, or plan to purchase, new equipment in 2023.
Roughly 45% of respondents have added, or plan to add, some type of equipment (washer, dryer, water heater, vending machine, or other) to their mix in 2023. By comparison, last year’s percentage was 42%.
Following is a breakdown of purchases that operators have already made in 2023, or plan to make by the end of the year (percentages do not total 100% because some buyers purchased or plan to purchase equipment from multiple categories):
- 13.8% of respondents have purchased, or plan to purchase, a new top loader this year, with the average buy being 7.3 machines.
- 65.5% of respondents have purchased, or plan to purchase, a new front loader this year, with the average buy being 20.2 machines. (Editor’s note: This accounting includes a small number of operators who have purchased or will purchase more than 100 machines.)
- 58.6% of respondents have purchased, or plan to purchase, a new dryer (regular or stack) this year, with the average buy being 23.2 machines. (Editor’s note: This accounting includes a small number of operators who have purchased or will purchase more than 100 machines.)
UTILITIES COST
Operators were asked about their 2022 utilities cost (as a percentage of gross). The individual responses ranged from 8% to 55%. Collectively, respondents paid an average of 21.8%, up slightly from 19.5% in last year’s survey.
The most common individual response—also most common in last year’s survey—was 20%. Whereas 57.5% reported a utilities cost of 20% or less last year, 54.2% reported the same this year.
FORECAST FOR 2023
Roughly 55% of respondents are optimistic that their 2023 total business will be better than 2022’s.
Some of the reasons they gave for their predictions were acquiring new equipment, raising vend prices, expanding wash-dry-fold pickup and delivery, adding commercial accounts, and beginning to accept payment by card.
About 35% expect their 2023 business to be about the same, while 9.2% say their business won’t perform as well in 2023 as it did in 2022.
Those who believe their business will be poorer in 2023 point to economic inflation and higher costs related to labor, rent and utilities as the reasons.
Miss earlier parts of this report? You can read them here: Part 1 — Part 2 — Part 3
Have a question or comment? E-mail our editor Bruce Beggs at [email protected].