
CHICAGO — How do you think your self-service business compared to others in the industry last year? Did you have a good year or a bad year in 2011? How does your pricing compare with others?
American Coin-Op’s annual State of the Industry survey offers you the opportunity to compare your operation to others in the industry. It focuses on 2011/2012 business conditions, pricing, equipment, common problems, turns per day, and utilities cost.
The survey is an unscientific electronic poll of American Coin-Op readers who operate stores.
ADDING EQUIPMENT IN 2011
Approximately 45% of the respondents purchased at least one piece of equipment (washer, dryer, water heater, vender or changer) in 2011. In 2010, that figure was 47%.
Here’s a breakdown of the 2011 purchases:
• 23.6% of respondents purchased at least one top loader. The average purchase was 17.1 machines (it should be noted that this statistic includes a single operator’s reported purchase of 97 machines; when excluding that operator, the average purchase is 9.1 machines).
• 28.9% of respondents purchased at least one front loader (a breakdown by capacity follows below).
• 12.4% purchased at least one dryer (regular or stacked). The average purchase was 11.3 machines (it should be noted that this statistic includes a single operator’s reported purchase of 97 machines; when excluding that operator, the average purchase is 5.1 machines).
And we break it down further by front-load wash capacity:
• 42.9% purchased at least one machine with a capacity up to 25 pounds. The average purchase was 8.9 machines.
• 48.6% bought at least one machine with a capacity of 25-50 pounds. The average purchase was 4.2 machines.
• 37.1% purchased at least one machine with a capacity of more than 50 pounds. The average purchase was 1.8 machines.
(Editor’s note: Some respondents didn’t identify machine sizes, so the front-loader breakdown doesn’t include their purchases. Also, the percentages do not total 100% because some buyers purchased equipment in multiple capacity categories.)
SHOPPING IN 2012
Respondents were asked if they have bought, or plan on buying, any new machinery this year. Approximately 36% intend to add something (washer, dryer, water heater, vender or changer) to their mix, or already have done so. Last year, this figure was 47%.
• 6.6% of respondents have purchased or plan to purchase a new top loader this year. The average purchase is (or will be) 10.4 machines.
• 21.5% have purchased or plan to purchase a new front loader this year. (A breakdown by capacity follows below.)
• 14% plan on buying, or have already bought, a dryer in 2012. The average purchase is (or will be) 7.0 machines.
And we break things down further by front-load wash capacity:
• 34.6% purchased or plan to purchase at least one machine with a capacity up to 25 pounds. The average purchase was 6.0 machines.
• 30.8% bought at least one machine with a capacity of 25-50 pounds. The average purchase was 4.1 machines.
• 23.1% purchased at least one machine with a capacity of more than 50 pounds. The average purchase was 2.5 machines.
(Editor’s note: Some respondents didn’t identify machine sizes, so the front-loader breakdown doesn’t include their purchases. Also, the percentages do not total 100% because some buyers purchased equipment in multiple capacity categories.)
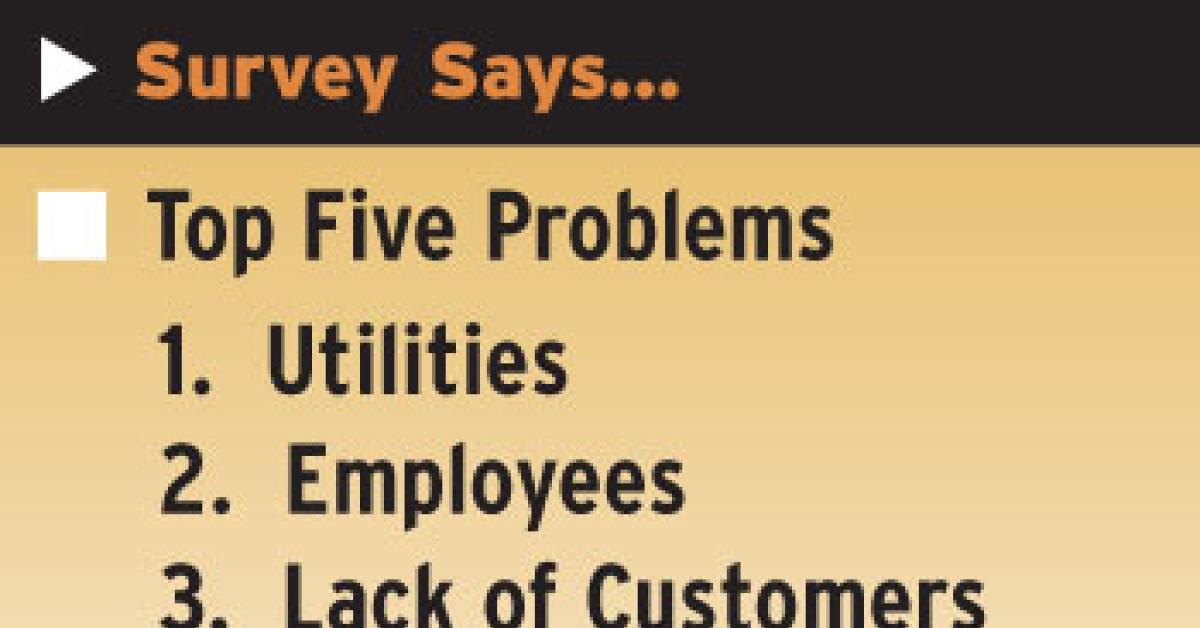
WE’VE GOT TROUBLE…
What problems cause you the most grief? Here are the top-five industry problems, according to the survey respondents:
- High cost of utilities
- Dealing with employees
- A lack of customers
- Poor economy
- Equipment maintenance/repair issues
Gone from last year’s list is rent, although it did pop up on a number of surveys.
TURNS
The average turns per day for top loaders are 3.0, up slightly from last year (2.9). The average turns per day for a front loader is 3.8, also up from last year (3.4).
UTILITIES
We asked operators about their utilities cost (as a percentage of gross). The responses ranged from 5.6% to 50%. The most popular response is 25%, followed by 20%.
Operators are paying an average of 24.1% for utilities (as a percentage of gross).
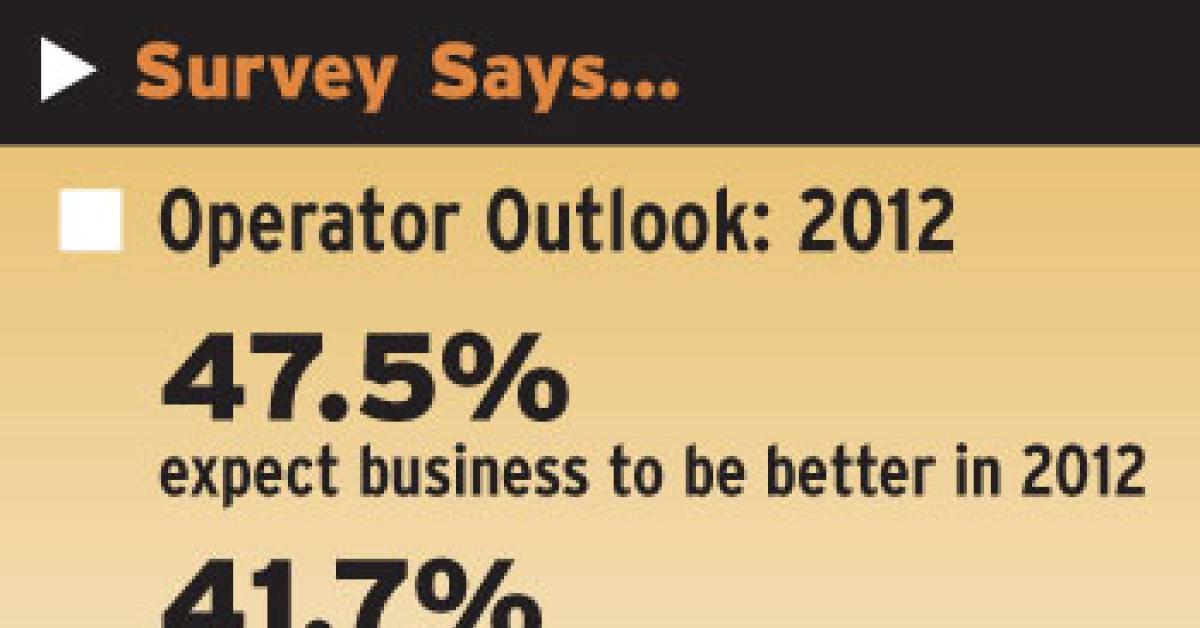
2012 BUSINESS FORECAST
Slightly less than half of the respondents (47.5%) expect their 2012 business to be better than it was in 2011. Approximately 42% expect business to be about the same this year, and 10.8% expect their business to not perform as well this year as it did in 2011.

Have a question or comment? E-mail our editor Bruce Beggs at [email protected].